What is BIKE app?
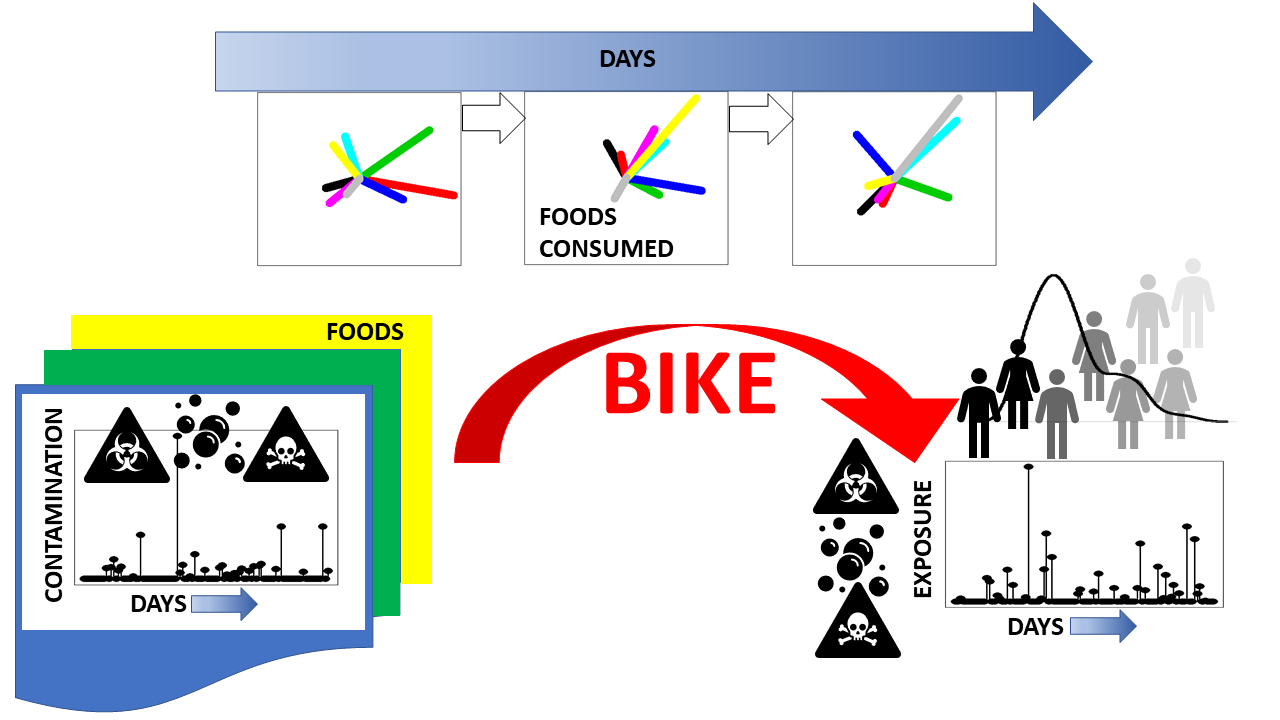
BIKE app is a graphical user interface developed for running the BIKE model (a Bayesian dietary exposure assessment model for microbiological and chemical hazards) and inspecting the results.
It is based on connected Bayesian hierarchical models, utilizing OpenBUGS and R in tandem. Chronic and acute exposures are estimated for chemical and microbiological hazards, respectively. Uncertainty and variability in exposures are visualized, and a few optional model structures are available.
BIKE app is open source and available from GitHub (https://github.com/jukran/BIKE2) . Simulated synthetic data resembling real occurrence and consumption data is provided with the code as an example.
Find more about BIKE model from:
Ranta J, Mikkelä A, Suomi J, Tuominen P. BIKE: Dietary Exposure Model for Foodborne Microbiological and Chemical Hazards. Foods. 2021; 10(11):2520. https://doi.org/10.3390/foods10112520
How to use the app?
1. Prepare and upload data files
To run BIKE, four separate files need to be prepared. They have to contain data for concentrations, consumptions, occurrence, and prevalence, respectively.
The columns in the files should have specific names. The names of the food types and the hazards should match in all data files.
The data should be uploaded as csv files using point (.) for decimal and comma (,) for field separation. The data should not contain any special characters (e.g., ä, ö, å, etc.).
Read more on how to prepare the files here.
2. Specify model settings and run simulations
BIKE provides an option to use model settings that are most suitable for the input data.
These include Consumption model, Correlation models, Priors for variances and Number of MCMC iterations.
Note that the time for the simulations to complete depends on the number of iterations selected. It is recommended to start with small numbers, e.g., the default 4000.
After the four files are uploaded and the model is set up, the simulations could be run.
3. Inspect the results
The results are visualized with figures and tables , and their content could be changed, e.g., food type, hazard, credible interval, etc.
In addition, adjustment factors for both the concentration level and the prevalence for each food-hazard combination could be assigned in the exposures section.
New 2D simulation for the quantiles figure is running after the button 'Generate plot' is pressed.
The exposure limit analyses table and the posterior predictive distribution summaries table generate after the button 'Generate table' is pressed.
The results could be downloaded as
html
and
rds
files. The
html
file contains
the input data, the settings used for the model, and the results as figures and tables. The
rds
file contains
the MCMC samples for all parameters.
Adjustment factors
Concentration factors
Prevalence factors
POSTERIOR PREDICTIVE DISTRIBUTION SUMMARIES
EXPOSURE LIMIT ANALYSIS
Download report
Report .html 1 The report will contain only the figures and tables currently visualized in the app. Generate 'Quantiles' figure before download! Generate 'Posterior summaries' and 'Exposure limit' tables before download!
MCMC samples .Rds The file contains the MCMC samples for all parameters for all hazards and food types.
To plot
Summarize
Analysis for
Plot options
Requirements for the input data
The data file with hazard concentrations has to contain at least the columns with the following headings: Type, Hazard, Concentration, LOQ, LOD, Unit . Each row should contain one measurement result of one hazard from one food type.
- Type : Name of the food item, e.g. Orange. These should match with the names used in consumption data.
- Hazard : Name of the hazard, e.g. Cadmium.
- Concentration : Value of the measured concentration. If the measurement is below LOQ the value should be marked as NA.
- LOQ : Limit of quantification. If the measurement is below LOD the value should be marked as NA.
- LOD : Limit of detection.
- Unit : Measurement units, e.g. mg.p.kg ,or cfu.p.g (use .p. instead of / ). The measurement unit for concentrations can be hazard specific, i.e., mg.p.g for some hazard and cfu.p.g for another, but these must have the same unit in divisor (e.g. gram) as is used in food consumption data for all foods.
Concentration data file may also contain other columns although these are not currently used in the model.
The column Type is for the food type in question, e.g. 'broiler'. This must be the same food type for which consumption data are given in the other data files, i.e., the names should be spelled exactly the same way. There can be other columns giving broader food categories, e.g. 'poultry' or 'meat foods', but these are not used in the model since the connection between hazard data and food consumption data is done at the finest feasible level of food type classification provided. Hence, 'Type' can denote raw ingredients or composite food types containing many ingredients. The names of the food types could be any character strings (without spaces), e.g. FoodEx2 codes or other naming system, but very long names should be avoided for clarity and for more compact labels in the plotting windows. For example, 'minced meat casserole' could be shortened to 'mmeatcas' when preparing the data files. The column Hazard specifies the hazard name in question, e.g., 'cadmium' or 'salmonella' for each row, while the Concentration column is for the numeric concentration values measured for the specific hazard name and food type.
Columns LOQ (limit of quantification) and LOD (limit of detection) specify the measurement limits. The notation format is the same for chemical hazards and microbiological hazards. The possibilities for each measurement are: reported numerical value (> LOQ), a value between LOQ and LOD, or a value below LOD. The limits can also be different for each measurement. If a concentration value is reported in column 'Concentration', it is interpreted as an exact measurement. If the value was between the two limits, then both LOQ and LOD need to be given as numerical values, while concentration is marked NA. If the value was below LOD, then LOD needs to be given as numerical value, and both concentration and LOQ are marked NA. In this way, BIKE will know which of the three situations is in question for each hazard concentration measurement per row.
The column Unit is for specifying the measurement units, e.g. mg/kg, or cfu/g. These are not automatically converted to be compatible in the calculations. Therefore, when preparing the data files compatible measurements must be used. If the concentration values are per gram, so must be the food consumption amounts as grams per day. A suitable measurement unit is such that it does not lead to extremely small or large numerical values since this could affect also the numerical computations. Therefore, sensible measurement units have to be selected.
The data file with food consumption has to contain at least the columns with the following names: IDnum, Weight, foodA1, foodA2, foodB1, foodB2, etc.
- IDnum : The respondent's number.
- Weight : Body weight of each respondent in kg . Must be given for all individuals. Missing values not allowed.
- Food type with reporting day : Name of the studied food items catenated with the index number of the reporting day. E.g Orange1 for the consumption of orange on day 1, and Orange2 for day 2, etc. There should be at least two reporting days for all respondents. These columns should contain consumptions of the food items for each respondent, e.g. grams per day. Note that the chosen weight units should match the units used for hazard concentrations. If food consumption is given as grams per day, the hazard concentrations in the food should be given as something per grams. BIKE does not convert measurement units.
The number of reporting days must be the same for all persons. Missing values not allowed. Consumption data file may also contain other columns although these are not currently used in the model. For example, age of respondents.
Food consumption data corresponds to food diary data format where daily food consumption amounts per each individual are tabulated per food item, row-by-row. The column named IDnum is for the respondent's number, Weight is for the bodyweight, and rest are the columns with names for the detailed food types consumed on a specific day. For example, broiler1 for consumption amounts of broiler on the first day. The next columns could be likewise fish1, apple1, etc. These columns would be followed by the same list of food types for the second day, e.g. broiler2, fish2, apple2, etc. There need to be at least two days recorded for each consumer and the same number of days for all. Each row represents the reported consumptions of one consumer. The food types can represent composite foods or raw ingredients as needed, but the names of the food types (apart from the day number as the last character) have to be the same as those used in the hazard concentration data. Each row gives either the consumed food amounts, or zeros, for the reported days. The measurement units also need to be compatible with those in the concentration data, e.g. consumptions in grams if concentrations are given per grams. Consumption data may originally come in a hierarchical form that has several levels of food types with increasing details, e.g. seafood, fish, smoked fish, smoked salmon. However, only one of those labels (character string without spaces) has to be selected and used throughout in consumption data as well as in concentration data. This labeling of food items can only be as detailed as both data sets permit.
The file with occurrence data needs to contain the columns with the following headings: hazardnames, hazardtypes, limitexpo, foodA, foodB, etc.
- 1 st column. hazardnames : List of the hazard names. E.g. Cadmium, Campylobacter.
- 2 nd column. hazardtypes : Type of the given hazard, chemical K or microbiological M .
- 3 rd column. limitexpo : Exposure limit for every hazard. It can be a health based guidance value, for example tolerable daily intake TDI. Note that the exposure calculated by BIKE is in units per day, and thus for a health based guidance value given in units per a longer time period you should adjust it to units per day.
- remaining columns. Names of the food types for the food items represented in data. These columns specify how the concentration of the hazard (row) in this food type (column) should be interpreted in the case where concentrations are below LOD. Either they represent strictly positives or all values which could include true zeros. BIKE will choose a model according to this selection. If concentration data about some food-hazard combination is missing, this should be marked as NA .
Note that 'all' for concentration information implies that the concentration distribution will be estimated jointly with prevalence parameter using a zero-inflated model where the fraction of measurements below LOD are interpreted allowing the possibility of true zeros. Then, prevalence data file should mark the corresponding hazard sample data as 'NA' to signify the hazard prevalence is not estimated from separate sample information.
The file should contain a table with rows for each hazard specifying the name of the hazard (e.g. 'cadmium'), the type ( 'K' for chemical, 'M' for microbiological), and the exposure limit. The remaining columns have headers according to the food types, and the row entry will specify whether the concentration data for that food-hazard pair should be interpreted to represent only truly positive concentrations (even when below LOD), or as any measurements which might contain also truly zeros when the measurement fell below LOD. In the former case, the correct entry is positives , and in the latter case the correct entry is all . If data for some food-hazard pair is missing, the correct entry is NA . Note that this interpretation applies to full set of concentration data for the particular food-hazard pair.
The file with prevalence data need to contain a table with columns with the following headings: hazardnames, hazardtypes, infoods, npositive, nsample.
- 1 st column. hazardnames : List of the hazard names.
- 2 nd column. hazardtypes : Type of the given hazard, chemical K or microbiological M .
- 3 rd column. infoods : Name of the food types in which the hazard occurs.
- 4 th column. npositive : Number of detected positive samples. If sample information is not available, this should be marked NA.
- 5 th column. nsample : Number of samples in total. If sample information is not available, this should be marked NA.
Note that 'NA' for sample information implies that the prevalence will be estimated jointly from the concentration data using a zero-inflated model where the fraction of measurements below LOD are interpreted allowing the possibility of true zeros. Then, occurrence data file should mark the corresponding hazard concentrations as 'all' to signify they may contain both true zeros and small positive values when below LOD.
The file with prevalence data need to contain a table with column names hazardnames, hazardtypes, infoods, npositive, nsample , in the exact came order (!), and the row entries for the last two columns will define the number of true positivesand the sample size to be used if the concentration data for that food-hazard pair should represent only positive concentrations. Otherwise, the number of true positives and the sample size are marked 'NA'. If the sample information is marked 'NA', then the corresponding entry in occurrence table should be 'all' to allow estimation of prevalence jointly with concentration distribution using zero-inflated modeling. Hence, the 'positives' in occurrence table should go together with specific values for prevalence sample data, and 'all' should go together with 'NA' in prevalence table.
Possible reasons for error messages after RUN
- The Concentrations data file does not fulfill The Requirements. Check if the values for Concentration, LOQ and LOD are correctly filled in.
- There is a food-hazard combination for which concentration data is available, but NA is written in the occurence data table.
- The section Exposures is opened and new model settings are selected.
- Tabs were switched when computation was in progress.
Incomplete list...
- Concentration+ positive concentration (zeros excluded).
- C.consumption/bw+ positive chronic (i.e. mean) consumption per bodyweight per consumption day (zeros excluded).
- A.consumption+ positive acute consumption per consumption day (zeros excluded).
- C.exposure/bw+ positive chronic (i.e. mean) exposure per bodyweight per exposure day (zeros excluded).
- A.exposure+ positive acute exposure per exposure day (zeros excluded).
- MCMC Markov chain Monte Carlo sampling method.
- uncertainty uncertainty of parameter values (represented by posterior distribution, realized as an MCMC sample).
- variability variability of quantities in a population, modelled as a distribution that depends on its parameters.
- quantile quantile point of a variability distribution.
- empirical distribution a distribution of data values as such.
- pseudo empirical distribution (of exposure) a distribution of exposure produced by sampling concentrations and consumptions directly from the separate data sets for each. Usually requires either LB or UB substitutions for values below LOQ or LOD, leading to lower or upper estimate of pseudo empirical exposure distribution.
- bootstrap resampling of data (without replacement) to create artificial random replicate of data, with original sample size.
- 2D simulation simulation of parameter values from uncertainty distribution (here by MCMC) and simulation of variable quantities from variability distributions (which are defined by parameters).
- consumption frequency proportion of actual consumption days in the long run.
- prevalence proportion of contaminated food items.
- LB substitution
- UB substitution
- posterior distribution
The source code is available at GitHub
Ranta J, Marinova-Todorova M, Mikkelä A, Suomi J, Tuominen P 2023. BIKE foodborne exposure model - A graphical user interface for the Bayesian dietary exposure assessment model for microbiological and chemical hazards (BIKE). Finnish Food Authority, Helsinki, Finland. Available at https://bike-expo-shiny.rahtiapp.fi/